Visualization (시각화)
데이터분석 및 보고에 필요한 시각화 패키지를 알아보고 실제 데이터로 시각화 예제를 다루어보자.
데이터 시각화는 데이터분석 과정에서 단순히 데이터를 살펴보는데 그치지 않고 다양한 분석 가능성을 보여준다.
또한 3자에게 설명을 함에 있어서도 데이터시각화는 굉장히 설득력있는 리포팅을 가능하게 한다.
1. Matplotlib
- 파이썬의 대표적인 시각화 패키지
- 패키지의 이름에서 느껴지듯 MATLAB의 수리데이터 시각화를 파이썬으로 옮겨온 컨셉
- 기본적인 형태의 다양한 시각화 함수를 제공
- 사용이 약간은 불편
1.1 matplotlib 설치 및 불러오기
import numpy as np
import pandas as pd
import matplotlib.pyplot as plt
# !pip install matplotlib
# matlab 사용자의 시각화 도구 사용가능
# 분석에 사용가능한 여러가지 시각화 함수를 제공합니다. 보통 plt라는 예명으로 사용합니다.
%matplotlib inline
# 주피터 노트북에 최적화 된 그래프 설정(코랩 사용불가)
# %matplotlib notebook
# 인터렉티브 그래프 가능(코랩 사용불가)
1.1.1 코랩 시각화 한글 폰트 사용
- 코랩
- !sudo apt-get install -y fonts-nanum
- !sudo fc-cache -fv
- !rm ~/.cache/matplotlib -rf
- 런타임 재시작
1.1.2 윈도우 한글 폰트 사용
- 윈도우 자체 한글폰트 사용가능
- 저작권 걱정없는 무료 한글 폰트 https://brunch.co.kr/@jade/203
- 네이버에서 배포하는 나눔바른고딕체 https://hangeul.naver.com/font
# os에 설치되어 있는 폰트리스트 확인
import matplotlib.font_manager as fm
fm.findSystemFonts(fontpaths=None, fontext='ttf')
'C:\\Windows\\Fonts\\bahnschrift.ttf',
 'C:\\Windows\\Fonts\\trebucit.ttf',
 'C:\\Windows\\Fonts\\CURLZ___.TTF',
 'C:\\Windows\\Fonts\\Gabriola.ttf',
 'C:\\Windows\\Fonts\\FRAHV.TTF',
 'C:\\Windows\\Fonts\\msyh.ttc',
 'C:\\Windows\\Fonts\\ANTQUAI.TTF',
 'C:\\Windows\\Fonts\\FORTE.TTF',
 'C:\\Windows\\Fonts\\timesi.ttf',
 'C:\\Windows\\Fonts\\PERTILI.TTF',
 'C:\\Windows\\Fonts\\BKANT.TTF',
 'C:\\Windows\\Fonts\\segoeuil.ttf',
 'C:\\Windows\\Fonts\\HTOWERT.TTF',
 'C:\\Windows\\Fonts\\CALISTBI.TTF',
 'C:\\Windows\\Fonts\\RAVIE.TTF',
 'C:\\Windows\\Fonts\\corbelli.ttf',
 'C:\\Windows\\Fonts\\ONYX.TTF',
 'C:\\Windows\\Fonts\\couri.ttf',
 'C:\\Windows\\Fonts\\ARIALNB.TTF',
 'C:\\Windows\\Fonts\\BRADHITC.TTF',
 'C:\\Windows\\Fonts\\monbaiti.ttf',
 'C:\\Windows\\Fonts\\ariblk.ttf',
 'C:\\Windows\\Fonts\\consolab.ttf',
 'C:\\Windows\\Fonts\\SCRIPTBL.TTF',
 'C:\\Windows\\Fonts\\segoeprb.ttf',
 'C:\\Windows\\Fonts\\BOD_BI.TTF',
 'C:\\Windows\\Fonts\\LBRITEI.TTF',
 'C:\\Windows\\Fonts\\REFSPCL.TTF',
 'C:\\Windows\\Fonts\\DUBAI-REGULAR.TTF',
 'C:\\Windows\\Fonts\\segoeuisl.ttf',
 'C:\\Windows\\Fonts\\LeelawUI.ttf',
 'C:\\Windows\\Fonts\\DUBAI-BOLD.TTF',
 'C:\\Windows\\Fonts\\OUTLOOK.TTF',
 'C:\\Windows\\Fonts\\CALISTB.TTF',
 'C:\\Windows\\Fonts\\segoescb.ttf',
 'C:\\Windows\\Fonts\\TCBI____.TTF',
 'C:\\Windows\\Fonts\\H2MKPB.TTF',
 'C:\\Windows\\Fonts\\corbel.ttf',
 'C:\\Windows\\Fonts\\TCMI____.TTF',
 'C:\\Windows\\Fonts\\comic.ttf',
 'C:\\Windows\\Fonts\\BRITANIC.TTF',
 'C:\\Windows\\Fonts\\VINERITC.TTF',
 'C:\\Windows\\Fonts\\malgunbd.ttf',
 'C:\\Windows\\Fonts\\Candarali.ttf',
 'C:\\Windows\\Fonts\\malgunsl.ttf',
 'C:\\Windows\\Fonts\\CENTURY.TTF',
 'C:\\Windows\\Fonts\\CALIFI.TTF',
 'C:\\Windows\\Fonts\\VIVALDII.TTF',
 'C:\\Windows\\Fonts\\IMPRISHA.TTF',
 'C:\\Windows\\Fonts\\LFAXDI.TTF',
 'C:\\Windows\\Fonts\\REFSAN.TTF',
 'C:\\Windows\\Fonts\\GOUDOSB.TTF',
 'C:\\Windows\\Fonts\\H2MJRE.TTF',
 'C:\\Windows\\Fonts\\BOD_B.TTF',
 'C:\\Windows\\Fonts\\tahomabd.ttf',
 'C:\\Windows\\Fonts\\msyi.ttf',
 'C:\\Windows\\Fonts\\TCCEB.TTF',
 'C:\\Windows\\Fonts\\Candarai.ttf',
 'C:\\Windows\\Fonts\\OCRAEXT.TTF',
 'C:\\Windows\\Fonts\\seguibli.ttf',
 'C:\\Windows\\Fonts\\CALISTI.TTF',
 'C:\\Windows\\Fonts\\ARLRDBD.TTF',
 'C:\\Windows\\Fonts\\INFROMAN.TTF',
 'C:\\Windows\\Fonts\\seguili.ttf',
 'C:\\Windows\\Fonts\\PAPYRUS.TTF',
 'C:\\Windows\\Fonts\\H2GSRB.TTF',
 'C:\\Windows\\Fonts\\trebucbi.ttf',
 'C:\\Windows\\Fonts\\KUNSTLER.TTF',
 'C:\\Windows\\Fonts\\seguisym.ttf',
 'C:\\Windows\\Fonts\\calibrib.ttf',
 'C:\\Windows\\Fonts\\BOD_BLAR.TTF',
 'C:\\Windows\\Fonts\\FRAHVIT.TTF',
 'C:\\Windows\\Fonts\\corbeli.ttf',
 'C:\\Windows\\Fonts\\GOTHIC.TTF',
 'C:\\Windows\\Fonts\\msjhbd.ttc',
 'C:\\Windows\\Fonts\\ERASDEMI.TTF',
 'C:\\Windows\\Fonts\\ntailub.ttf',
 'C:\\Windows\\Fonts\\GOUDOSI.TTF',
 'C:\\Windows\\Fonts\\segoepr.ttf',
 'C:\\Windows\\Fonts\\consola.ttf',
 'C:\\Windows\\Fonts\\HMKMMAG.TTF',
 'C:\\Windows\\Fonts\\D2CodingBold-Ver1.3.2-20180524.ttf',
 'C:\\Windows\\Fonts\\GLSNECB.TTF',
 'C:\\Windows\\Fonts\\segoeuii.ttf',
 'C:\\Windows\\Fonts\\consolaz.ttf',
 'C:\\Windows\\Fonts\\PLAYBILL.TTF',
 'C:\\Windows\\Fonts\\sylfaen.ttf',
 'C:\\Windows\\Fonts\\GOTHICBI.TTF',
 'C:\\Windows\\Fonts\\LTYPEO.TTF',
 'C:\\Windows\\Fonts\\ROCK.TTF',
 'C:\\Windows\\Fonts\\STENCIL.TTF',
 'C:\\Windows\\Fonts\\constanb.ttf',
 'C:\\Windows\\Fonts\\FRSCRIPT.TTF',
 'C:\\Windows\\Fonts\\WINGDNG2.TTF',
 'C:\\Windows\\Fonts\\CALIST.TTF',
 'C:\\Windows\\Fonts\\LFAXD.TTF',
 'C:\\Windows\\Fonts\\constan.ttf',
 'C:\\Windows\\Fonts\\H2PORL.TTF',
 'C:\\Windows\\Fonts\\simsunb.ttf',
 'C:\\Windows\\Fonts\\georgiab.ttf',
 'C:\\Windows\\Fonts\\SHOWG.TTF',
 'C:\\Windows\\Fonts\\corbell.ttf',
 'C:\\Windows\\Fonts\\cambriai.ttf',
 'C:\\Windows\\Fonts\\TCCB____.TTF',
 'C:\\Windows\\Fonts\\PERB____.TTF',
 'C:\\Windows\\Fonts\\ariali.ttf',
 'C:\\Windows\\Fonts\\BOOKOSB.TTF',
 'C:\\Windows\\Fonts\\calibrii.ttf',
 'C:\\Windows\\Fonts\\NirmalaS.ttf',
 'C:\\Windows\\Fonts\\BOD_CBI.TTF',
 'C:\\Windows\\Fonts\\LeelUIsl.ttf',
 'C:\\Windows\\Fonts\\LSANSD.TTF',
 'C:\\Windows\\Fonts\\cambriab.ttf',
 'C:\\Windows\\Fonts\\DUBAI-MEDIUM.TTF',
 'C:\\Windows\\Fonts\\PERBI___.TTF',
 'C:\\Windows\\Fonts\\BOOKOSBI.TTF',
 'C:\\Windows\\Fonts\\GILC____.TTF',
 'C:\\Windows\\Fonts\\LSANS.TTF',
 'C:\\Windows\\Fonts\\ELEPHNT.TTF',
 'C:\\Windows\\Fonts\\framd.ttf',
 'C:\\Windows\\Fonts\\BOD_PSTC.TTF',
 'C:\\Windows\\Fonts\\LBRITEDI.TTF',
 'C:\\Windows\\Fonts\\phagspab.ttf',
 'C:\\Windows\\Fonts\\SCHLBKB.TTF',
 'C:\\Windows\\Fonts\\ARIALN.TTF',
 'C:\\Windows\\Fonts\\msyhbd.ttc',
 'C:\\Windows\\Fonts\\mmrtextb.ttf',
 'C:\\Windows\\Fonts\\GIGI.TTF',
 'C:\\Windows\\Fonts\\BOOKOSI.TTF',
 'C:\\Windows\\Fonts\\FRABK.TTF',
 'C:\\Windows\\Fonts\\seguisli.ttf',
 'C:\\Windows\\Fonts\\BRLNSB.TTF',
 'C:\\Windows\\Fonts\\PERTIBD.TTF',
 'C:\\Windows\\Fonts\\Inkfree.ttf',
 'C:\\Windows\\Fonts\\BRUSHSCI.TTF',
 'C:\\Windows\\Fonts\\COPRGTL.TTF',
 'C:\\Windows\\Fonts\\MAGNETOB.TTF',
 'C:\\Windows\\Fonts\\H2GPRM.TTF',
 'C:\\Windows\\Fonts\\simsun.ttc',
 'C:\\Windows\\Fonts\\FRABKIT.TTF',
 'C:\\Windows\\Fonts\\BOOKOS.TTF',
 'C:\\Windows\\Fonts\\LSANSDI.TTF',
 'C:\\Windows\\Fonts\\GOTHICB.TTF',
 'C:\\Windows\\Fonts\\palai.ttf',
 'C:\\Windows\\Fonts\\SegoeIcons.ttf',
 'C:\\Windows\\Fonts\\HATTEN.TTF',
 'C:\\Windows\\Fonts\\verdana.ttf',
 'C:\\Windows\\Fonts\\FTLTLT.TTF',
 'C:\\Windows\\Fonts\\msyhl.ttc',
 'C:\\Windows\\Fonts\\GOUDYSTO.TTF',
 'C:\\Windows\\Fonts\\calibrili.ttf',
 'C:\\Windows\\Fonts\\ERASMD.TTF',
 'C:\\Windows\\Fonts\\HMKMAMI.TTF',
 'C:\\Windows\\Fonts\\micross.ttf',
 'C:\\Windows\\Fonts\\constani.ttf',
 'C:\\Windows\\Fonts\\cambria.ttc',
 'C:\\Windows\\Fonts\\LHANDW.TTF',
 'C:\\Windows\\Fonts\\PARCHM.TTF',
 'C:\\Windows\\Fonts\\ebrimabd.ttf',
 'C:\\Windows\\Fonts\\H2SA1M.TTF',
 'C:\\Windows\\Fonts\\verdanai.ttf',
 'C:\\Windows\\Fonts\\GOUDOS.TTF',
 'C:\\Windows\\Fonts\\AGENCYR.TTF',
 'C:\\Windows\\Fonts\\FRADMCN.TTF',
 'C:\\Windows\\Fonts\\segoeuiz.ttf',
 'C:\\Windows\\Fonts\\arialbd.ttf',
 'C:\\Windows\\Fonts\\Candarab.ttf',
 'C:\\Windows\\Fonts\\BERNHC.TTF',
 'C:\\Windows\\Fonts\\calibril.ttf',
 'C:\\Windows\\Fonts\\palab.ttf',
 'C:\\Windows\\Fonts\\H2MJSM.TTF',
 'C:\\Windows\\Fonts\\malgun.ttf',
 'C:\\Windows\\Fonts\\cambriaz.ttf',
 'C:\\Windows\\Fonts\\framdit.ttf',
 'C:\\Windows\\Fonts\\BOD_CI.TTF',
 'C:\\Windows\\Fonts\\ALGER.TTF',
 'C:\\Windows\\Fonts\\AGENCYB.TTF',
 'C:\\Windows\\Fonts\\PALSCRI.TTF',
 'C:\\Windows\\Fonts\\BROADW.TTF',
 'C:\\Windows\\Fonts\\GILB____.TTF',
 'C:\\Windows\\Fonts\\HMFMPYUN.TTF',
 'C:\\Windows\\Fonts\\SCHLBKBI.TTF',
 'C:\\Windows\\Fonts\\GILSANUB.TTF',
 'C:\\Windows\\Fonts\\MSUIGHUB.TTF',
 'C:\\Windows\\Fonts\\SNAP____.TTF',
 'C:\\Windows\\Fonts\\JUICE___.TTF',
 'C:\\Windows\\Fonts\\LTYPEBO.TTF',
 'C:\\Windows\\Fonts\\LeelaUIb.ttf',
 'C:\\Windows\\Fonts\\BAUHS93.TTF',
 'C:\\Windows\\Fonts\\GILI____.TTF',
 'C:\\Windows\\Fonts\\Candaral.ttf',
 'C:\\Windows\\Fonts\\ELEPHNTI.TTF',
 'C:\\Windows\\Fonts\\ERASLGHT.TTF',
 'C:\\Windows\\Fonts\\symbol.ttf',
 'C:\\Windows\\Fonts\\courbd.ttf',
 'C:\\Windows\\Fonts\\DUBAI-LIGHT.TTF',
 'C:\\Windows\\Fonts\\segmdl2.ttf',
 'C:\\Windows\\Fonts\\BOD_R.TTF',
 'C:\\Windows\\Fonts\\segoeuib.ttf',
 'C:\\Windows\\Fonts\\BOD_I.TTF',
 'C:\\Windows\\Fonts\\seguisbi.ttf',
 'C:\\Windows\\Fonts\\WINGDNG3.TTF',
 'C:\\Windows\\Fonts\\TCM_____.TTF',
 'C:\\Windows\\Fonts\\H2HDRM.TTF',
 'C:\\Windows\\Fonts\\ITCEDSCR.TTF',
 'C:\\Windows\\Fonts\\GIL_____.TTF',
 'C:\\Windows\\Fonts\\BRLNSR.TTF',
 'C:\\Windows\\Fonts\\LATINWD.TTF',
 'C:\\Windows\\Fonts\\arialbi.ttf',
 'C:\\Windows\\Fonts\\ANTQUAB.TTF',
 'C:\\Windows\\Fonts\\calibri.ttf',
 'C:\\Windows\\Fonts\\seguibl.ttf',
 'C:\\Windows\\Fonts\\LEELAWDB.TTF',
 'C:\\Windows\\Fonts\\FRAMDCN.TTF',
 'C:\\Windows\\Fonts\\BOD_BLAI.TTF',
 'C:\\Windows\\Fonts\\LTYPE.TTF',
 'C:\\Windows\\Fonts\\COPRGTB.TTF',
 'C:\\Windows\\Fonts\\GARA.TTF',
 'C:\\Windows\\Fonts\\ENGR.TTF',
 'C:\\Windows\\Fonts\\calibriz.ttf',
 'C:\\Windows\\Fonts\\taileb.ttf',
 'C:\\Windows\\Fonts\\segoesc.ttf',
 'C:\\Windows\\Fonts\\corbelb.ttf',
 'C:\\Windows\\Fonts\\ARIALNBI.TTF',
 'C:\\Windows\\Fonts\\msgothic.ttc',
 'C:\\Windows\\Fonts\\MSUIGHUR.TTF',
 'C:\\Windows\\Fonts\\MTEXTRA.TTF',
 'C:\\Windows\\Fonts\\LTYPEB.TTF',
 'C:\\Windows\\Fonts\\ROCCB___.TTF',
 'C:\\Windows\\Fonts\\ebrima.ttf',
 'C:\\Windows\\Fonts\\CENSCBK.TTF',
 'C:\\Windows\\Fonts\\Candara.ttf',
 'C:\\Windows\\Fonts\\seguisb.ttf',
 'C:\\Windows\\Fonts\\cour.ttf',
 'C:\\Windows\\Fonts\\timesbd.ttf',
 'C:\\Windows\\Fonts\\marlett.ttf',
 'C:\\Windows\\Fonts\\trebucbd.ttf',
 'C:\\Windows\\Fonts\\holomdl2.ttf',
 'C:\\Windows\\Fonts\\times.ttf',
 'C:\\Windows\\Fonts\\l_10646.ttf',
 'C:\\Windows\\Fonts\\OLDENGL.TTF',
 'C:\\Windows\\Fonts\\seguihis.ttf',
 'C:\\Windows\\Fonts\\verdanaz.ttf',
 'C:\\Windows\\Fonts\\MTCORSVA.TTF',
 'C:\\Windows\\Fonts\\YuGothM.ttc',
 'C:\\Windows\\Fonts\\palabi.ttf',
 'C:\\Windows\\Fonts\\HMFMMUEX.TTC',
 'C:\\Windows\\Fonts\\BSSYM7.TTF',
 'C:\\Windows\\Fonts\\ANTQUABI.TTF',
 'C:\\Windows\\Fonts\\gadugi.ttf',
 'C:\\Windows\\Fonts\\NirmalaB.ttf',
 'C:\\Windows\\Fonts\\arial.ttf',
 'C:\\Windows\\Fonts\\Nirmala.ttf',
 'C:\\Windows\\Fonts\\BASKVILL.TTF',
 'C:\\Windows\\Fonts\\consolai.ttf',
 'C:\\Windows\\Fonts\\wingding.ttf',
 'C:\\Windows\\Fonts\\mingliub.ttc',
 'C:\\Windows\\Fonts\\ROCC____.TTF',
 'C:\\Windows\\Fonts\\FRADM.TTF',
 'C:\\Windows\\Fonts\\corbelz.ttf',
 'C:\\Windows\\Fonts\\HMKMRHD.TTF',
 'C:\\Windows\\Fonts\\YuGothL.ttc',
 'C:\\Windows\\Fonts\\LBRITED.TTF',
 'C:\\Windows\\Fonts\\SitkaVF.ttf',
 'C:\\Windows\\Fonts\\MISTRAL.TTF',
 'C:\\Windows\\Fonts\\ROCKEB.TTF',
 'C:\\Windows\\Fonts\\VLADIMIR.TTF',
 'C:\\Windows\\Fonts\\NGULIM.TTF',
 'C:\\Windows\\Fonts\\LFAXI.TTF',
 'C:\\Windows\\Fonts\\comicz.ttf',
 'C:\\Windows\\Fonts\\BELL.TTF',
 'C:\\Windows\\Fonts\\MAIAN.TTF',
 'C:\\Windows\\Fonts\\LSANSI.TTF',
 'C:\\Windows\\Fonts\\ERASBD.TTF',
 'C:\\Windows\\Fonts\\phagspa.ttf',
 'C:\\Windows\\Fonts\\gadugib.ttf',
 'C:\\Windows\\Fonts\\SitkaVF-Italic.ttf',
 'C:\\Windows\\Fonts\\JOKERMAN.TTF',
 'C:\\Windows\\Fonts\\NIAGSOL.TTF',
 'C:\\Windows\\Fonts\\LFAX.TTF',
 'C:\\Windows\\Fonts\\impact.ttf',
 'C:\\Windows\\Fonts\\taile.ttf',
 'C:\\Windows\\Fonts\\mmrtext.ttf',
 'C:\\Windows\\Fonts\\CENTAUR.TTF',
 'C:\\Windows\\Fonts\\verdanab.ttf',
 'C:\\Windows\\Fonts\\courbi.ttf',
 'C:\\Windows\\Fonts\\comicbd.ttf',
 'C:\\Windows\\Fonts\\georgiai.ttf',
 'C:\\Windows\\Fonts\\NIAGENG.TTF',
 'C:\\Windows\\Fonts\\GLECB.TTF',
 'C:\\Windows\\Fonts\\BELLI.TTF',
 'C:\\Windows\\Fonts\\GARAIT.TTF',
 'C:\\Windows\\Fonts\\CHILLER.TTF',
 'C:\\Windows\\Fonts\\TEMPSITC.TTF',
 'C:\\Windows\\Fonts\\constanz.ttf',
 'C:\\Windows\\Fonts\\BRLNSDB.TTF',
 'C:\\Windows\\Fonts\\gulim.ttc',
 'C:\\Windows\\Fonts\\GILBI___.TTF',
 'C:\\Windows\\Fonts\\HMFMOLD.TTF',
 'C:\\Windows\\Fonts\\H2GTRM.TTF',
 'C:\\Windows\\Fonts\\seguiemj.ttf',
 'C:\\Windows\\Fonts\\ARIALNI.TTF',
 'C:\\Windows\\Fonts\\COOPBL.TTF',
 'C:\\Windows\\Fonts\\YuGothB.ttc',
 'C:\\Windows\\Fonts\\RAGE.TTF',
 'C:\\Windows\\Fonts\\georgia.ttf',
 'C:\\Windows\\Fonts\\SegUIVar.ttf',
 'C:\\Windows\\Fonts\\ntailu.ttf',
 'C:\\Windows\\Fonts\\GARABD.TTF',
 'C:\\Windows\\Fonts\\MATURASC.TTF',
 'C:\\Windows\\Fonts\\ROCKI.TTF',
 'C:\\Windows\\Fonts\\trebuc.ttf',
 'C:\\Windows\\Fonts\\GILLUBCD.TTF',
 'C:\\Windows\\Fonts\\CALIFR.TTF',
 'C:\\Windows\\Fonts\\FRADMIT.TTF',
 'C:\\Windows\\Fonts\\PERI____.TTF',
 'C:\\Windows\\Fonts\\tahoma.ttf',
 'C:\\Windows\\Fonts\\georgiaz.ttf',
 'C:\\Windows\\Fonts\\LCALLIG.TTF',
 'C:\\Windows\\Fonts\\ROCKB.TTF',
 'C:\\Windows\\Fonts\\ITCBLKAD.TTF',
 'C:\\Windows\\Fonts\\GOTHICI.TTF',
 'C:\\Windows\\Fonts\\BOD_CR.TTF',
 'C:\\Windows\\Fonts\\D2Coding-Ver1.3.2-20180524-all.ttc',
 'C:\\Windows\\Fonts\\BELLB.TTF',
 'C:\\Windows\\Fonts\\HARLOWSI.TTF',
 'C:\\Windows\\Fonts\\comici.ttf',
 'C:\\Windows\\Fonts\\FELIXTI.TTF',
 'C:\\Windows\\Fonts\\H2GTRE.TTF',
 'C:\\Windows\\Fonts\\Candaraz.ttf',
 'C:\\Windows\\Fonts\\webdings.ttf',
 'C:\\Windows\\Fonts\\TCCM____.TTF',
 'C:\\Windows\\Fonts\\HTOWERTI.TTF',
 'C:\\Windows\\Fonts\\MOD20.TTF',
 'C:\\Windows\\Fonts\\HARNGTON.TTF',
 'C:\\Windows\\Fonts\\msjh.ttc',
 'C:\\Windows\\Fonts\\H2PORM.TTF',
 'C:\\Windows\\Fonts\\CALIFB.TTF',
 'C:\\Windows\\Fonts\\himalaya.ttf',
 'C:\\Windows\\Fonts\\msjhl.ttc',
 'C:\\Windows\\Fonts\\BOD_CB.TTF',
 'C:\\Windows\\Fonts\\PRISTINA.TTF',
 'C:\\Windows\\Fonts\\POORICH.TTF',
 'C:\\Windows\\Fonts\\ROCKBI.TTF',
 'C:\\Windows\\Fonts\\FREESCPT.TTF',
 'C:\\Windows\\Fonts\\segoeui.ttf',
 'C:\\Windows\\Fonts\\LEELAWAD.TTF',
 'C:\\Windows\\Fonts\\CASTELAR.TTF',
 'C:\\Windows\\Fonts\\COLONNA.TTF',
 'C:\\Windows\\Fonts\\javatext.ttf',
 'C:\\Windows\\Fonts\\mvboli.ttf',
 'C:\\Windows\\Fonts\\lucon.ttf',
 'C:\\Windows\\Fonts\\ITCKRIST.TTF',
 'C:\\Windows\\Fonts\\timesbi.ttf',
 'C:\\Windows\\Fonts\\LBRITE.TTF',
 'C:\\Windows\\Fonts\\TCB_____.TTF',
 'C:\\Windows\\Fonts\\pala.ttf',
 'C:\\Windows\\Fonts\\SCHLBKI.TTF',
 'C:\\Windows\\Fonts\\batang.ttc',
 'C:\\Windows\\Fonts\\YuGothR.ttc',
 'C:\\Windows\\Fonts\\PER_____.TTF']
# plt 패키지의 전역글꼴로 family 파라메터에 사용가능한 폰트이름 전달(가장 간단한 방법)
# 주피터 노트북 실행 시 한번 실행으로 한번에 글꼴 설정
plt.rc('font', family='gulim')
# 혹은 폰트 경로를 직접 전달해줘도 동작한다.
# 다만 사용가능한 폰트 목록과 확장자명 확인이 필요하다.
font_location = 'C:/Windows/Fonts/malgun.ttf' # for windows
font_location = '/Library/Fonts/Arial Unicode.ttf' # for 맥
font_nm = fm.FontProperties(fname=font_location).get_name() # 폰트명 가져와서 변수에 저장
# plt.title('한글타이틀', fontproperties=font_nm) # 개별 함수에 전달
# 마이너스 글꼴 깨짐 해결
import matplotlib as mpl
mpl.rcParams['axes.unicode_minus'] = False
1.2 기본적인 line plot 그리기
- line plot은 시간 혹은 순서에 따라 데이터가 어떻게 변화하는지를 보기위해 주로 사용합니다.
ex) 주가데이터, 전력수요량, 매출, 수요
# numpy array로 시각화 데이터 생성
# arange, linspace
x = np.arange(-10, 11)
y = x ** 2
y

x1 = np.linspace(-10,10,50)
x1

y1 = x1 ** 2
y1
# line plot - plt.plot(x축 데이터, y축 데이터)
# plt.show() plt 함수로 정의 한 그래프 설정을 그래프화 시키는 명령어
plt.plot(x,y)
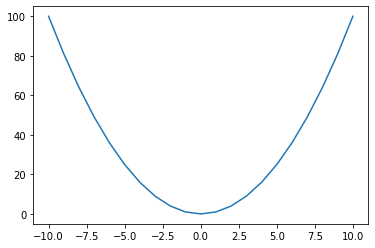
plt.plot(x1,y1)

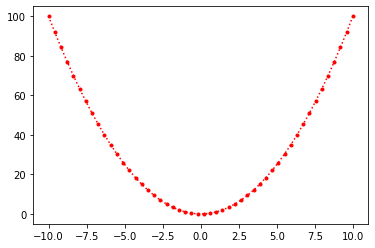
1.2.1 스타일 지정
plot() 함수는 보는 사람이 그래프를 조금 더 보기 편하게 하기 위한 다양한 스타일을 지원한다.
plot(데이터, '문자열인수')
# line plot 스타일 지정
# 스타일 문자열은 색, 마커, 선 종류 순으로 지정하며 만약 이중 일부가 생략되면 디폴트 값이 적용된다.
plt.plot(x1,y1,"r.:")
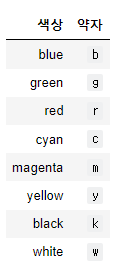
1.2.2 자주 사용하는 선스타일 색상
자주 사용되는 색깔은 한글자 약자를 사용할 수 있으며 약자는 아래 표에 정리하였다.
1.2.3 마커
데이터의 위치를 표기하는 기호를 마커라고 합니다.
사용가능한 마커의 종류를 아래 정리 해두었습니다.

1.2.4 선 스타일
선 스타일에는 실선(solid), 대시선(dashed), 점선(dotted), 대시-점선(dash-dit)을 사용가능합니다.

1.2.5 그래프에 옵션 추가하기
지금부터는 plt 의 다른 함수를 사용하여 보는 사람의 이해를 도울 수 있는 여러 기능들을 알아보자.
- figure : 그래프가 그려지는 캔버스 설정
- title : 그래프 제목
- xlabel, ylabel : 축 설명
- legend : 범례이름
- xlim, ylim : 축 범위
- xticks, yticks : 축 구간 내 필요한 구간만 추리기
figure : 그래프가 그려지는 캔버스 설정
title : 그래프 제목
xlabel, ylabel : 축 설명
legend : 범례이름
xlim, ylim : 축 범위
xticks, yticks : 축 구간 내 필요한 구간만 추리기

plt.figure(figsize=( 8, 5)) # 그래프가 그려지는 캔버스 설정
plt.plot(x1 ,y1,"g:") # 선그래프 정의
plt.show() # 정의된 그래프를 플로팅

# 그래프 타이틀 지정
plt.figure(figsize=( 8, 5)) # 그래프가 그려지는 캔버스 설정
plt.plot(x1 ,y1,"g:") # 선그래프 정의
plt.title("$x^2$") # 그래프 타이틀 지정 # $표시로 감싸면 수학기호 표현이 된다.
plt.show() # 정의된 그래프를 플로팅
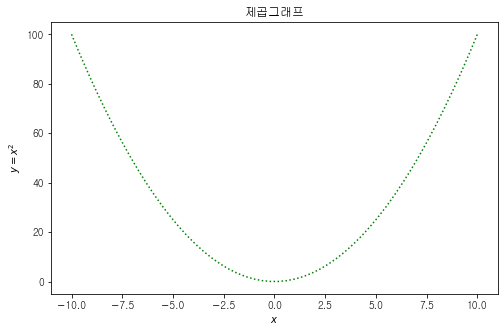
# 축 타이틀 지정 (축 설명)
plt.figure(figsize=( 8, 5)) # 그래프가 그려지는 캔버스 설정
plt.plot(x1 ,y1,"g:") # 선그래프 정의
plt.title("제곱그래프")
# 그래프 타이틀 지정
# $표시로 감싸면 수학기호 표현이 된다.
# 힌글 폰트 쓰기 1.1.2  윈도우 한글 폰트 사용 확인
plt.xlabel("$x$") # x축 설명
plt.ylabel("$y=x^2$") # y축 설명
plt.show() # 정의된 그래프를 플로팅
# 범례지정
# plot에 label지정 plt.legend()

plt.figure(figsize=( 8, 7)) # 그래프가 그려지는 캔버스 설정
plt.plot(x1 ,y1,"g:",label = "$x^2$") # 선그래프 정의
plt.plot(x1 ,x1 ** 3,"r:",label = "$x^3$") # 선그래프 정의
plt.title("$x^2andx^3$") # 그래프 타이틀 지정
plt.xlabel("$x$") # x축 설명
plt.ylabel("$y=x^2$") # y축 설명
plt.legend(loc = "best") # 범례 표시 함수
plt.show() # 정의된 그래프를 플로팅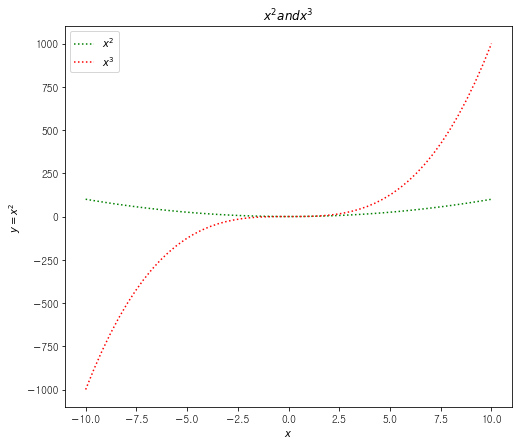
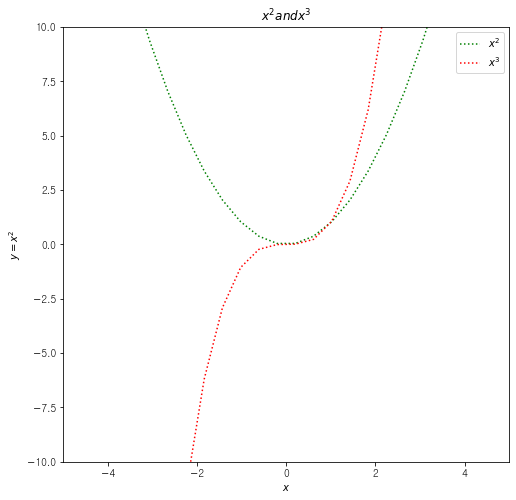
# 축 범위 설정
plt.figure(figsize=( 8, 8)) # 그래프가 그려지는 캔버스 설정
plt.plot(x1 ,y1,"g:",label = "$x^2$") # 선그래프 정의
plt.plot(x1 ,x1 ** 3,"r:",label = "$x^3$") # 선그래프 정의
plt.title("$x^2 and x^3$") # 그래프 타이틀 지정
plt.xlabel("$x$") # x축 설명
plt.ylabel("$y=x^2$") # y축 설명

plt.xlim([-5,5]) # x축 범위설정
plt.ylim([-10,10]) # y축 범위설정

plt.legend(loc = "best") # 범례 표시 함수
plt.show() # 정의된 그래프를 플로팅
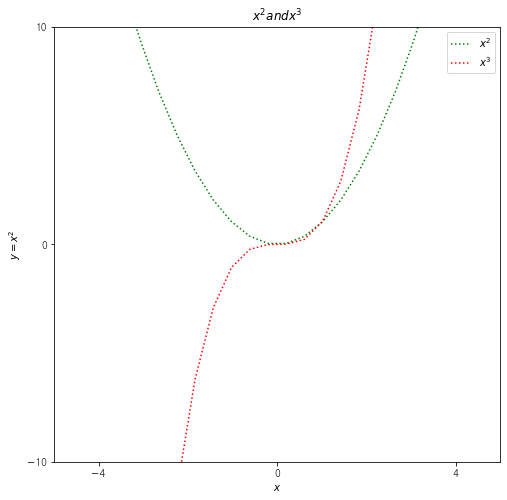
# 축 구간 지정
plt.figure(figsize=( 8, 8)) # 그래프가 그려지는 캔버스 설정
plt.plot(x1 ,y1,"g:",label = "$x^2$") # 선그래프 정의
plt.plot(x1 ,x1 ** 3,"r:",label = "$x^3$") # 선그래프 정의
plt.title("$x^2 and x^3$") # 그래프 타이틀 지정
plt.xlabel("$x$") # x축 설명
plt.ylabel("$y=x^2$") # y축 설명
plt.xlim([-5,5]) # x축 범위설정
plt.ylim([-10,10]) # y축 범위설정
plt.legend(loc = "best") # 범례 표시 함수
plt.xticks([-4,0,4]) # x축 표시 내용 설정
plt.yticks([-10,0,10]) # x축 표시 내용 설정
plt.show() # 정의된 그래프를 플로팅
1.2.6 연습문제
y축에 x의 sin, cos 그래프를 그려보자.
라인 색상구분을 지어주고, 선은 대쉬 선과 점선으로 구분, 마커는 없다.
제목은 'sin(x) and cos(x)', plot label설정으로 범례지정도 해주자.
# x값 설정
x = np.linspace(-5, 5, 100)
sin = np.sin(x)
cos = np.cos(x)
# CODE HERE
plt.plot(x, sin, 'r:', label='$sin(x)$')
plt.plot(x, cos, 'y--', label='$cos(x)$')
plt.legend()
plt.show()
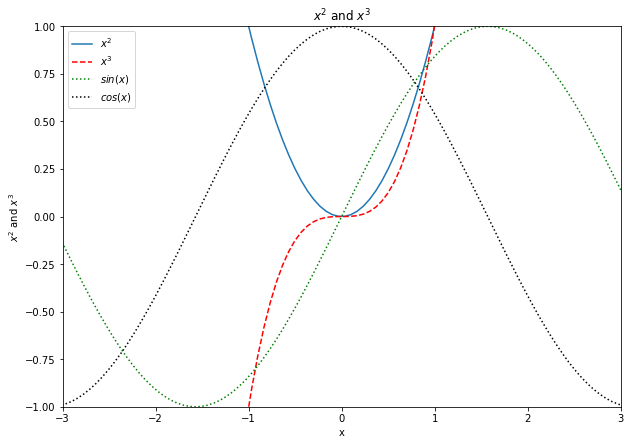
1.3 여러가지 그래프 한꺼번에 그리기
# plot을 여러개 사용하여 그래프를 여러개 그릴수 있다.
plt.figure(figsize=(10, 7))
plt.title('$x^2$ and $x^3$')
x = np.linspace(-10, 10, 300)
plt.plot(x, x*x, label='$x^2$')
plt.plot(x, x*x*x, 'r--', label='$x^3$')
plt.plot(x, np.sin(x), 'g:', label='$sin(x)$')
plt.plot(x, np.cos(x), 'k:', label='$cos(x)$')
plt.ylabel('$x^2$ and $x^3$')
plt.xlabel('x')
plt.xlim(-3, 3)
plt.ylim(-1, 1)
plt.legend(loc='best')
plt.show()
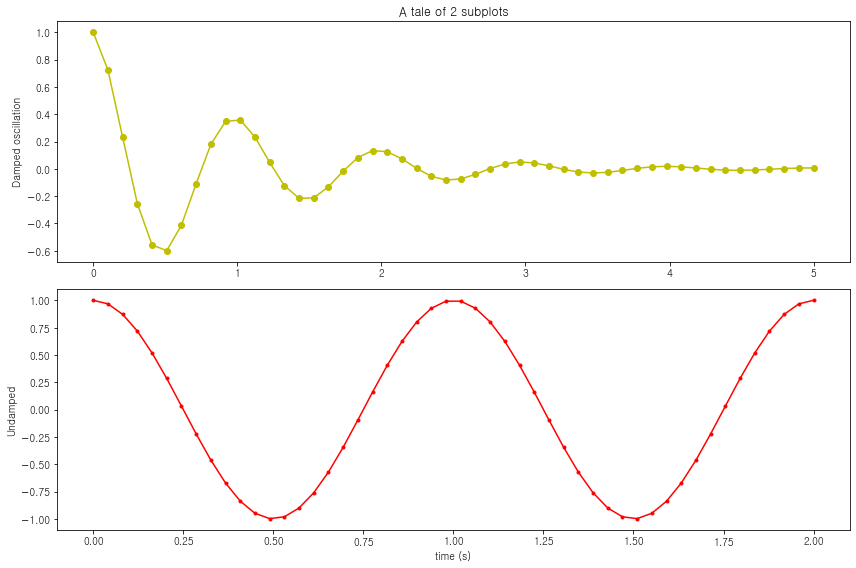
1.3.1 subplot을 사용하여 여러 그래프를 개별적으로 그리기
# 2 x 1 figure 매트릭스에 그래프 그리기
x1 = np.linspace(0.0, 5.0)
x2 = np.linspace(0.0, 2.0)
y1 = np.cos(2 * np.pi * x1) * np.exp(-x1)
y2 = np.cos(2 * np.pi * x2)

plt.figure(figsize=(12, 8))

plt.subplot(2,1,1) # 도화지 나누기 2행 1열 그래프의 첫번째
plt.plot(x1, y1, 'yo-')
plt.title('A tale of 2 subplots')
plt.ylabel('Damped oscillation')

plt.subplot(2,1,2) # 도화지 나누기 2행 1열 그래프의 두번째
plt.plot(x2, y2, 'r.-')
plt.xlabel('time (s)')
plt.ylabel('Undamped')

plt.tight_layout() # 여백줄이기
plt.show()
1.3.2 subplot 연습문제
2 x 2 figure subplot설정
매트릭스에 위에 1.3에서 그린 제곱, 세제곱, sin, cos 그래프 나누어 그려봅시다
# CODE HERE
plt.figure(figsize=(20, 10))
plt.title('$x^2$ and $x^3$')

plt.subplot(2, 2, 1)
plt.plot(x, x*x, label='$x^2$')
plt.legend()

plt.subplot(2, 2, 2)
plt.plot(x, x*x*x, 'r--', label='$x^3$')
plt.legend()

plt.subplot(2, 2, 3)
plt.plot(x, np.sin(x), 'g:', label='$sin(x)$')
plt.legend()

plt.subplot(2, 2, 4)
plt.plot(x, np.cos(x), 'k:', label='$cos(x)$')
plt.legend()

plt.show()

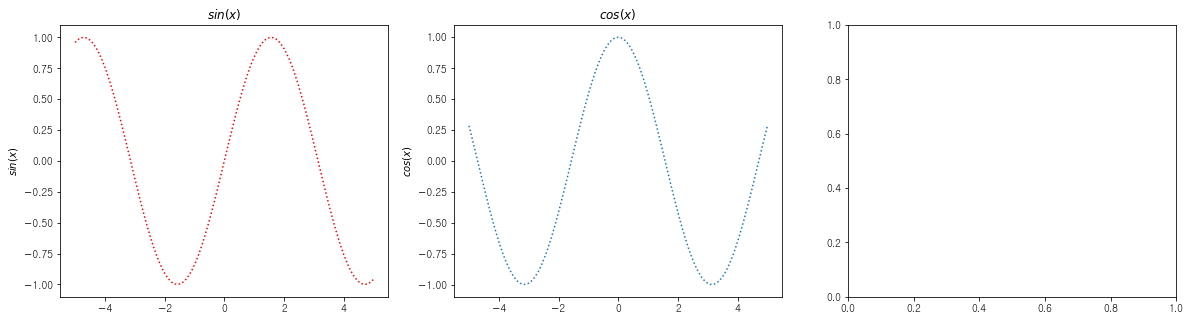
1.3.3 matplotlib 권장 subplot 코딩 style
기존에 사용하던 subplot의 축방향 ax 지정을 통해 플랏 랜더링과 옵션을 추가한다.
fig, ax = plt.subplots(행, 열)
ax.plot( )
ax.set_title( )
ax.set_xlabel( )
...
fig.tight_layout()
fig.savefig(파일명)
x = np.linspace(-5, 5, 100)
sin = np.sin(x)
cos = np.cos(x)

fig, ax = plt.subplots(1, 3, figsize=(20, 5))
ax[0].plot(x, sin, 'r:')
ax[0].set_title('$sin(x)$')
ax[0].set_ylabel('$sin(x)$')

ax[1].plot(x, cos, ':')
ax[1].set_title('$cos(x)$')
ax[1].set_ylabel('$cos(x)$')

plt.show()
1.3.4 subplot 연습문제 1
plot_data 폴더 내 개별종목파일 ex) 000660.csv 에 접근하여 종가데이터를 모두 그려보겠습니다.
- csv 파일 하나만을 데이터프레임으로 읽어들입니다.
- 개별 종목데이터를 확인합니다.
- 조건식을 사용하여 확장자명이 csv인 파일명을 리스트로 만듭니다.
- (반복문 사용 실제 작업 시작) 파일명 리스트를 순환하면서 파일명을 전달하여 데이터프레임으로 읽어들입니다.
- Date 컬럼을 인덱스로 설정합니다. (건너 뛰어도 됨)
- line plot 으로 Close 컬럼을 출력합니다.
- x축 표시 내용을 정리하기 위해 제공 된 ticker 함수를 사용하여 x축 표시 내용을 정리합니다.
import os # 파이썬 내장 패키지 컴퓨터의 운영체제 명령어를 파이썬으로 활용할 수 있게 해주는 패키지

for file_nm in os.listdir():
    if file_nm.endswith('csv'):
        print(file_nm)
000660.csv
207940.csv
035420.csv
012330.csv
005930.csv
# x축 표시 내용을 정리하기 위한 함수 사용
from matplotlib import ticker # import
locator = ticker.AutoLocator() # 표시내용을 자동으로 정리해주는 locator객체를 만들고
# ax.xaxis.set_major_locator(locator) # ax 축설정 함수에 파라메터로 전달, ax 인덱싱은 하셔야합니다.
fig, ax = plt.subplots(5, 1, figsize=(20, 20))
file_list = []
for file_nm in os.listdir('/Users/byun/0_lecture/SSAC/data/plot_data/'):
    if file_nm.endswith('csv'):
        file_list.append(file_nm)
        for index, file in enumerate(file_list):
            df = pd.read_csv(file)
            ax[index].plot(df['Date'], df['Close'])
            ax[index].xaxis.set_major_locator(locator)

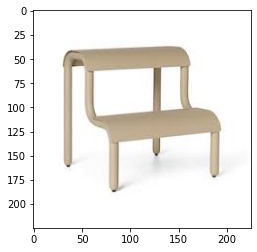
1.3.5 subplot image 불러오기
# 개별이미지 확인
img = plt.imread("C:/Users/JIN SEONG EUN/Desktop/빅데이터 분석가 과정/SeSAC/data/plot_data/chair1.jpeg")
plt.imshow(img)
path = "C:/Users/JIN SEONG EUN/Desktop/빅데이터 분석가 과정/SeSAC/data/plot_data/"


for file_name in os.listdir(path):
    if not file_name.endswith('csv'):
        img = plt.imread("C:/Users/JIN SEONG EUN/Desktop/빅데이터 분석가 과정/SeSAC/data/plot_data/chair1.jpeg")
        plt.imshow(img)
chair1.jpeg
chair2.jpeg
chair61.webp
decotique-habit-chair3.webp
department-uni-chair5.webp
table1.png
table2.png
table3.png
table4.png
table5.webp
1.4 분석을 위한 다양한 시각화 함수들
plt.bar()
plt.pie()
plt.hist()
plt.scatter()
plt.boxplot()
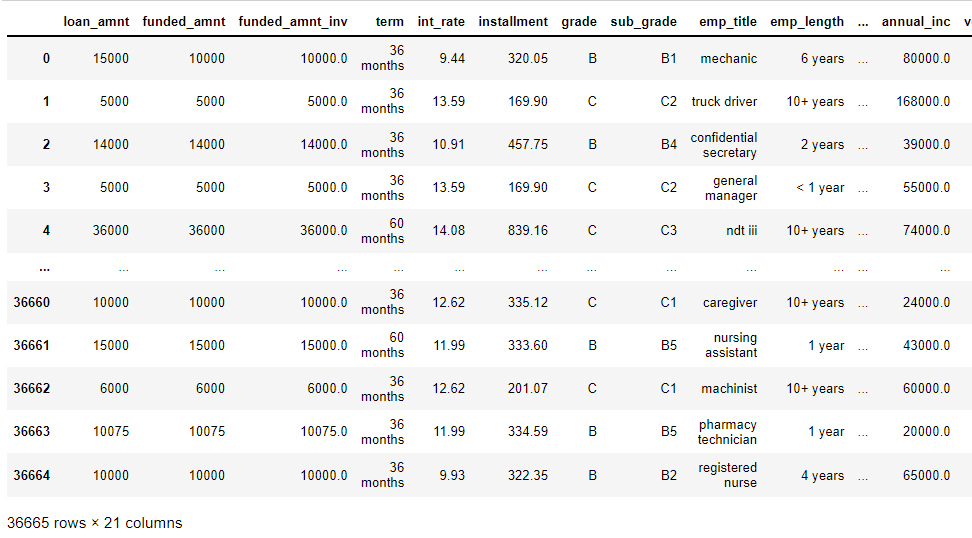
지금부터는 pandas를 학습하면서 사용했던 loan1.csv 파일을 불러들여 사용하겠습니다.
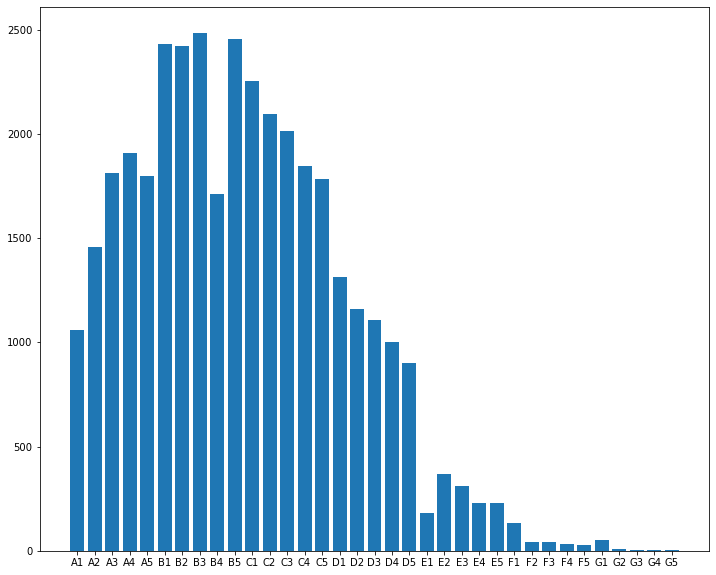
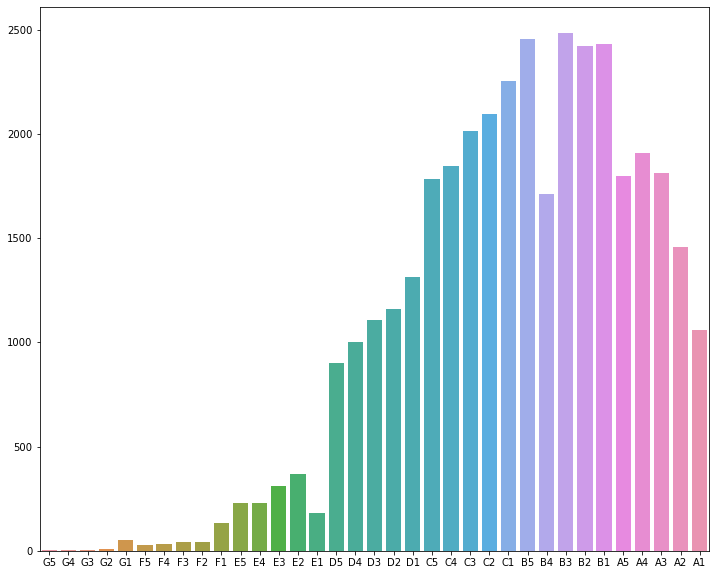
1.4.1 bar plot
카테고리컬 데이터 컬럼의 정량비교를 위해 사용
카테고리에 매칭되는 각 고윳값의 갯수를 count 하여 y 값으로 전달
# loan1.csv 파일 불러들이기
df = pd.read_csv("C:/Users/JIN SEONG EUN/Desktop/빅데이터 분석가 과정/SeSAC/data/final.csv")
df
# 세부신용등급 각 항목별 갯수세기
df["sub_grade"].value_counts().sort_index()
A1 1061
A2 1458
A3 1810
A4 1910
A5 1796
B1 2431
B2 2421
B3 2483
B4 1711
B5 2455
C1 2255
C2 2093
C3 2015
C4 1847
C5 1784
D1 1311
D2 1158
D3 1105
D4 1003
D5 900
E1 183
E2 366
E3 311
E4 228
E5 227
F1 135
F2 41
F3 40
F4 33
F5 29
G1 50
G2 7
G3 2
G4 4
G5 2
Name: sub_grade, dtype: int64
plt.figure(figsize=(12, 10))
plt.bar(df["sub_grade"].value_counts().sort_index(ascending=True).index, df["sub_grade"].value_counts().sort_index(ascending=True).values)
plt.show()
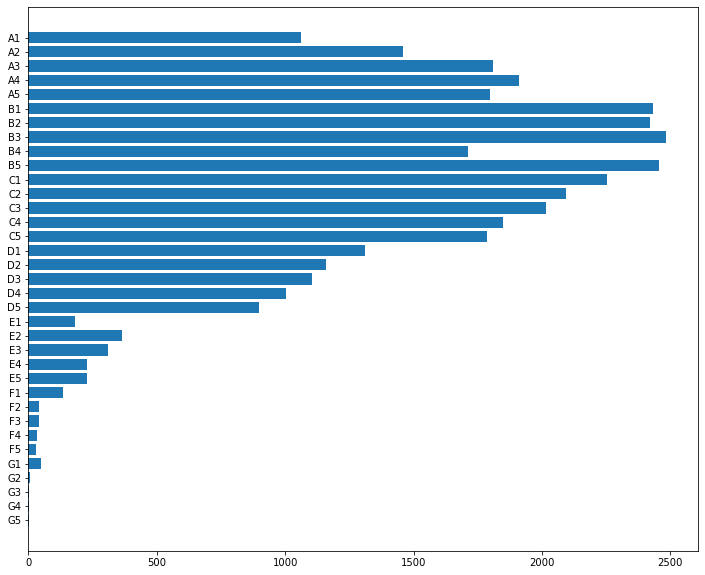
1.4.2 pie plot
plt.figure(figsize=(12, 10))
plt.barh(df["sub_grade"].value_counts().sort_index(ascending=False).index, df["sub_grade"].value_counts().sort_index(ascending=False).values)
plt.show()
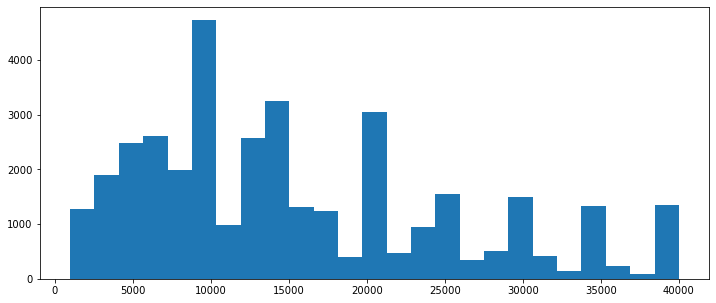
1.4.2 히스토그램
연속형 데이터의 분포를 확인하고자 할 때 많이 사용하는 시각화 방법
전체 데이터 구간 중 특정 구간에 속한 데이터의 빈도수를 count 하여 구간에 매칭
데이터 구간별 밀도를 확인할 수 있다.
# 대출금액분포 hist plot으로 확인

plt.figure(figsize=(12, 5))
plt.hist(df["loan_amnt"],bins=25)
plt.show()
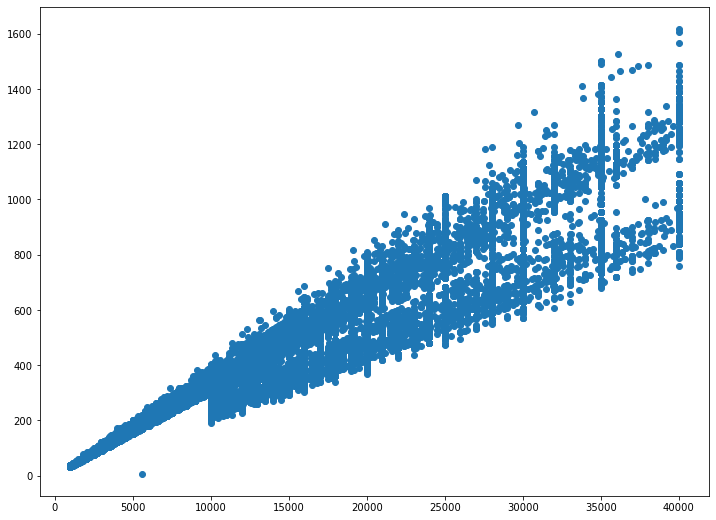
1.5 scatter plot
2개 혹은 2개 이상의 변수간의 관계를 확인하고자 할 때 많이 사용하는 시각화 방법.
X축과 Y축에 각각의 변수 데이터를 위치시키고 포인트들이 자리한 평면상의 분포를 통해 상관관계를 파악할 수 있다.
# 각각의 변수와 우리가 보고자 하는 값과의 관계를 볼 때 가장 많이 사용
# loan_amnt(대출금액), installment(원리금)
# 캔버스에 그려지는 점하나가 샘플 하나

plt.figure(figsize=(12, 9))
plt.scatter(df["loan_amnt"],df["installment"])
plt.show()
2. matplotlib 예제 살펴보기
matplotlib 홈페이지에 다양한 예제가 있다.
확인해보자.
https://matplotlib.org/stable/plot_types/index.html
Plot types — Matplotlib 3.5.2 documentation
Overview of many common plotting commands in Matplotlib. Note that we have stripped all labels, but they are present by default. See the gallery for many more examples and the tutorials page for longer examples. Unstructured coordinates Sometimes we collec
matplotlib.org
3. seaborn
- 많은 데이터분석가들이 주로 사용하는 시각화 라이브러리
- matplotlib에 비해 기본적인 시각적 심미성이 뛰어나다.
- matplotlib에서 지원하지 않는 다양한 형태의 시각화도구를 제공.
# 패키지 설치
!pip install seaborn

# 패키지 import
import seaborn as sns
3.1 barplot
plt.figure(figsize=(12, 10))
sns.barplot(df["sub_grade"].value_counts().sort_index(ascending=False).index, df["sub_grade"].value_counts().sort_index(ascending=False).values)
plt.show()
3.2 countplot
# 쉬운 방법으로 barplot 구현이 가능하다.

plt.figure(figsize=(12, 10))
sns.countplot(df["grade"],order=["A","B","C","D","E","F","G"])
plt.show()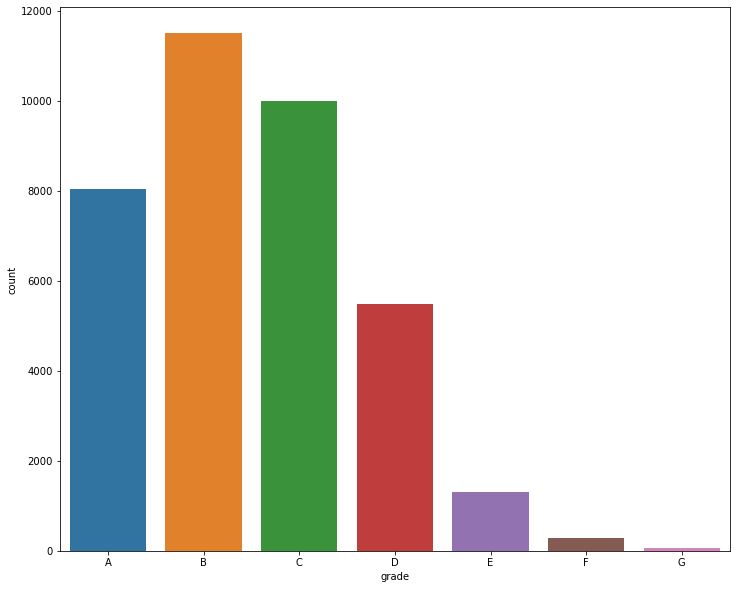
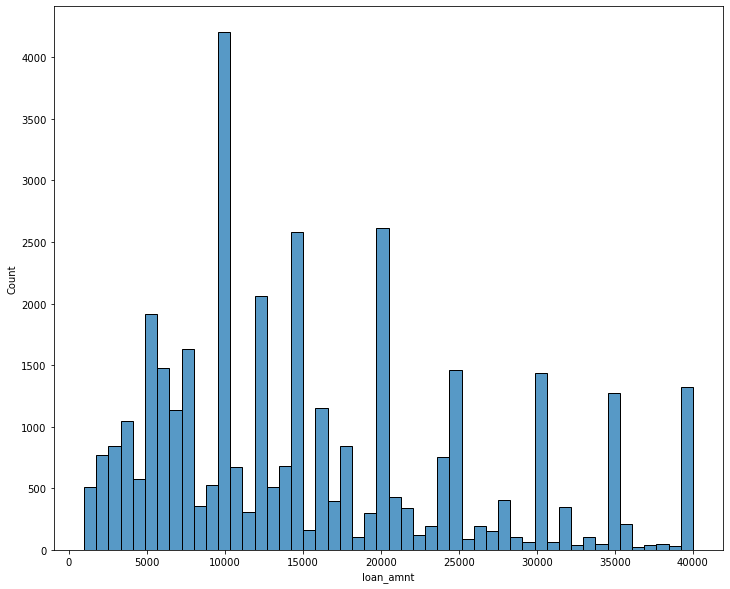
3.2 distplot(히스토그램)
plt.figure(figsize=(12, 10))
sns.histplot(df["loan_amnt"])
plt.show()
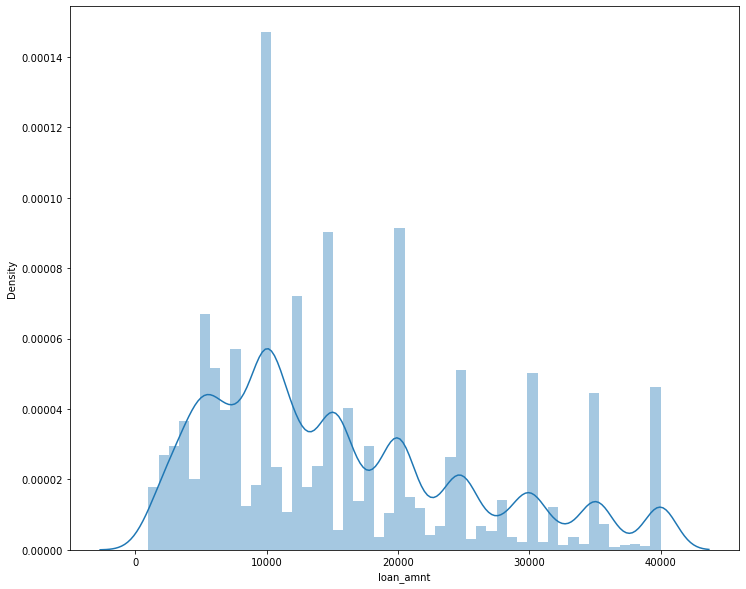
Seaborn Distplot represents the overall distribution of continuous data variables.
plt.figure(figsize=(12, 10))
sns.distplot(df["loan_amnt"])
plt.show()
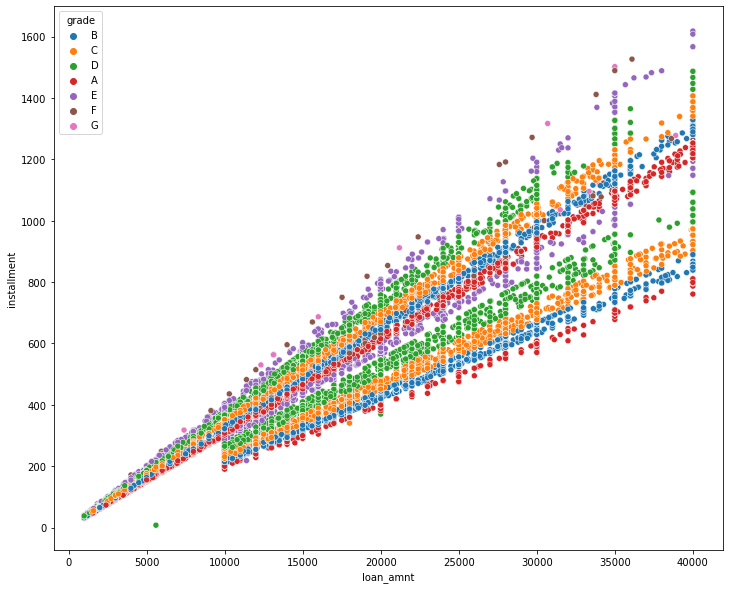
3.4 scatterplot
plt.figure(figsize=(12, 10))
# sns.scatterplot(df["loan_amnt"],df["installment"]) # 예전방식 plt랑 동일한 방법으로 사용가능
sns.scatterplot(data=df, x="loan_amnt",y="installment", hue="grade" ) # sns 권장방식을 사용하자
# hue 범례표시 scatterplot에 유용하게 쓰인다.

plt.show()
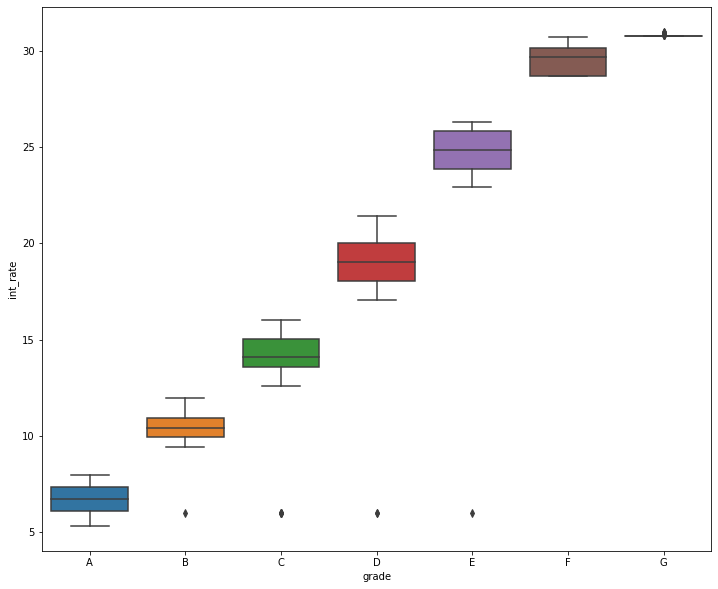
3.5 boxplot
# 굉장히 많이 사용
# 각각의 box하나당 해당 데이터의 사분위수, 중앙값, 최대, 최소값을 표기한다.

plt.figure(figsize=(12, 10))

sns.boxplot(data=df,
            x="grade",
            y="int_rate",
            order=["A","B","C","D","E","F","G"] ) # order-> x축에 해당하는 값을 어떻게 정렬할지 결정

# sns 권장방식을 사용하자
# 여러가지 범위를 제공해줌
# 이자율이 신용등급에 따라 겹치지 않는다 - > 이쟈율은 신용 등급에 따라서 결정된다.


plt.show()
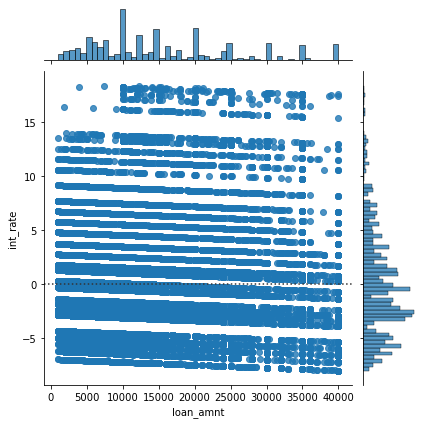
3.6 jointplot
# loan_amnt, int_rate의 scatter plot + hist plot의 결합형태인 joint plot
plt.figure(figsize=(12, 10))

sns.jointplot(data=df,
            x="loan_amnt",
            y="int_rate",
              kind="resid" # "scatter" | "kde" | "hist" | "hex" | "reg" | "resid"

           )

plt.show()
3.7 pairplot
각 변수간 상관관계를 확인하는 scatterplot의 확장버전
데이터프레임의 모든 변수에 대한 상관관계를 그리드 형태의 scatter로 표현
# 각 컬럼간 모든 scatter plot을 그리는 pairplot
# 데이터를 한번 훑어볼때 사용하기 편하다.

plt.figure(figsize=(15, 15))

sns.pairplot(data=df)

plt.show()

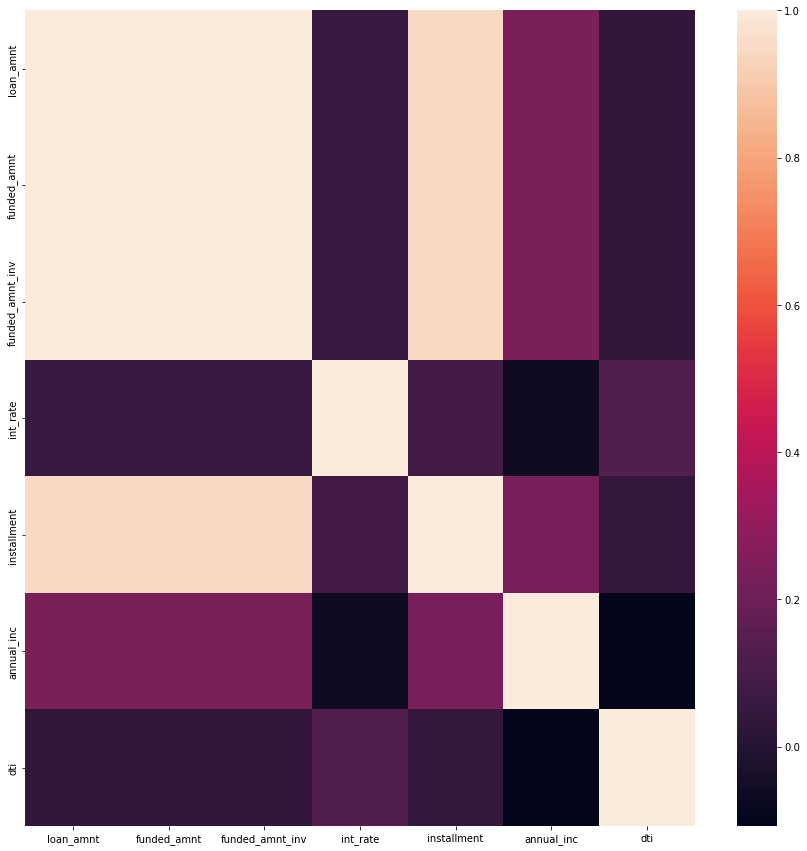
3.8 heatmap
각 변수간 상관관계를 모두 확인하고자 하는 목적은 pairplot과 같음
다만 scatterplot 형태가 아닌 상관계수를 계산하여 열지도로 표현
각 변수간 관계를 한눈에 보기 좋은 형태
df.corr()
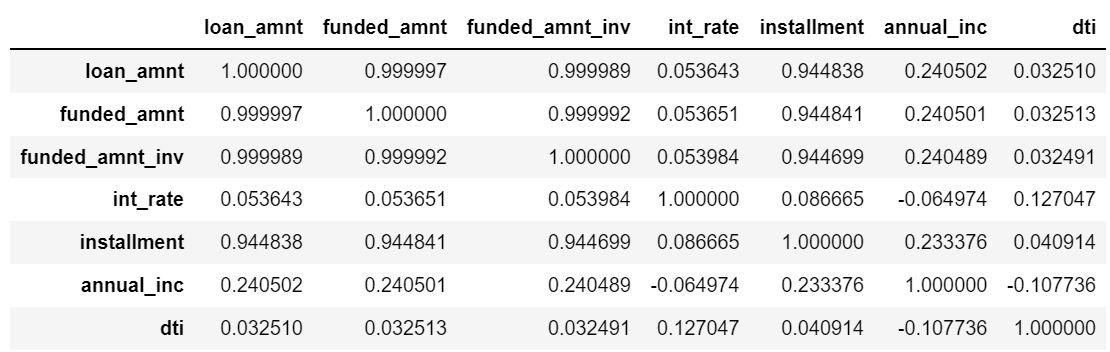
plt.figure(figsize=(15, 15))

sns.heatmap(data=df.corr() )

plt.show()
# 결측치 확인할 때 쓰는 도구

plt.figure(figsize=(20, 20))
sns.heatmap(df.isna())

# 여기서 emp_tiltle 이 결측치가 보임을 알 수 있다.
'Python > Data Analysis Library' 카테고리의 다른 글
| Pandas_ex (연습문제) (0) | 2022.07.27 |
|---|---|
| 02. Package pandas finance (0) | 2022.07.27 |
| 01. Package_Numpy (0) | 2022.07.25 |
| Part03 Chapter.02 데이터 분석 라이브러리 09. seaborn plots (실습) (0) | 2022.07.24 |
| Part03 Chapter.02 데이터 분석 라이브러리 08 pyplot 기초 (실습) (0) | 2022.07.24 |


